
FlashpointBI · Product
Your ERP data, one question away.
FlashpointBI is an AI-powered business intelligence platform that connects directly to your ERP system and delivers answers through Microsoft Teams. No new logins. No pre-built reports. No waiting on IT.
FlashpointBI is patent-pending technology developed by YTBE, Inc.
Why FlashpointBI
Ask your ERP questions in Microsoft Teams.
Built for mid-market teams running SAP ByDesign and NetSuite.
An authentication architecture that propagates each user’s identity directly to the ERP across three federated security boundaries.
No service accounts. No shared credentials. No data copies. Setup typically takes days, depending on your ERP and permissions.
Product demos
See it running
Each demo plays when you scroll to it. Pause it, step through it, or open it fullscreen.
Ask in plain English
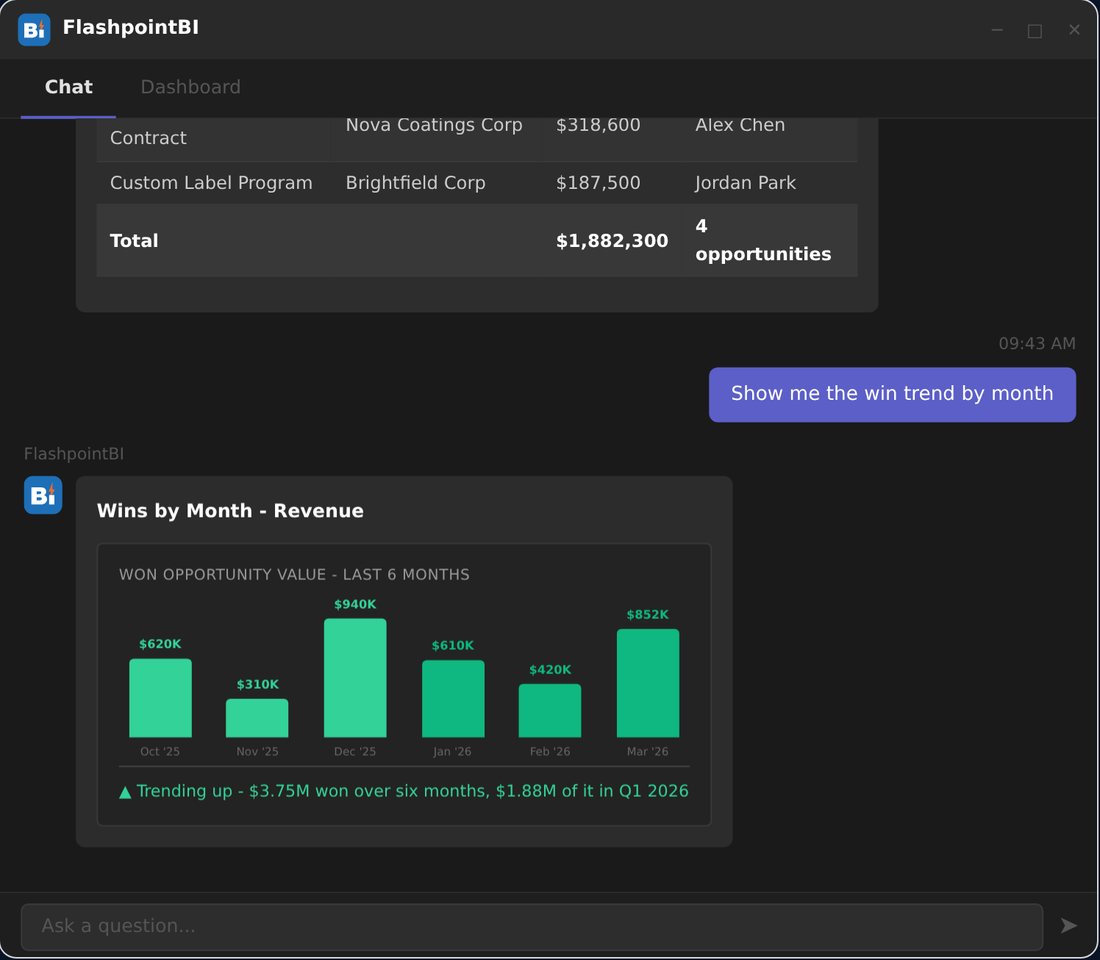
Ask a question in plain English and get instant answers with tables, charts, and insights drawn from the data you’re already collecting. Follow up naturally to drill deeper, filter results, or pivot to a new angle.
Every query runs under the asking user’s own credentials. Your ERP’s permission model is enforced automatically, so sales reps see their accounts, managers see their teams, and finance sees the full picture.
Dynamic dashboards
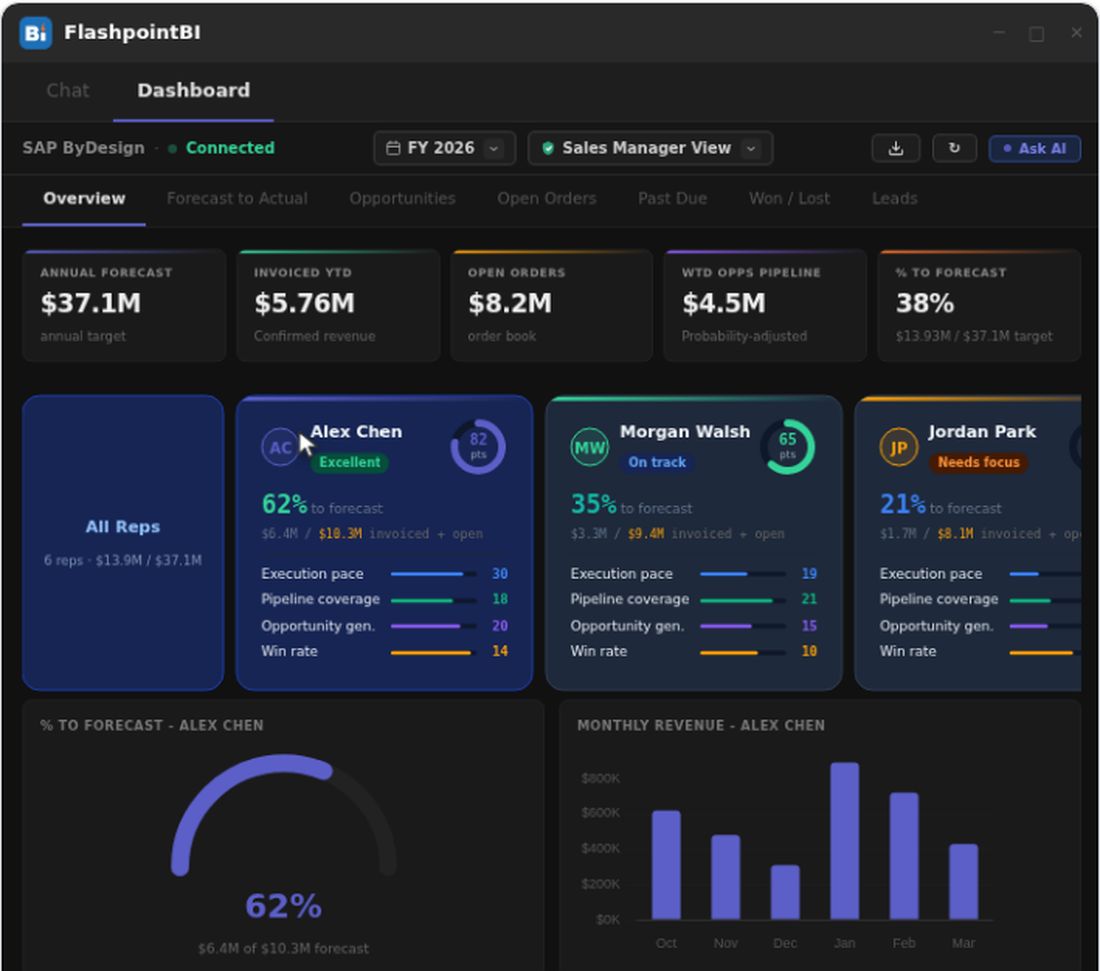
Live dashboards powered by your ERP, not a data warehouse. FlashpointBI includes a real-time dashboard embedded as a tab in Microsoft Teams, right next to the chat. KPIs, scorecards, pipeline charts, and forecast gauges update directly from SAP ByDesign or NetSuite with zero ETL.
Each sales rep gets a performance scorecard with composite scoring across execution pace, pipeline coverage, opportunity generation, and win rate. Click any rep to drill into their individual metrics. Switch between fiscal years or quarters and watch the entire dashboard refresh in seconds.
The dashboard and chat work together. See something interesting in a chart? Ask the AI about it. Want to add a new view? Just describe what you need.
Traceability
Every number traces back to its source. Click any chart bar, pie wedge, or table row to drill into the individual records behind it. Sort by any column. Export to Excel with one click.
For full transparency, every card and drill-down includes a data lineage view showing the exact ERP report, fields, filters, and API query that produced the displayed values. Finance can verify that “Invoiced YTD” matches their P&L by inspecting the underlying query and running it independently.
When AI modifies or adds a dashboard card, the same lineage system applies. You always know where the numbers came from, even on AI-generated views.
Ask AI about any card
Your dashboard has a conversation layer. Reference any card with # to give the AI full context about its data source, calculation, and current value. Ask it to explain a metric, break it down differently, or modify the visualization.
The AI can add new cards to your dashboard, backed by live ERP queries. Drag and drop to reposition. Publish changes for your team or keep them as a personal draft. Every AI-generated card inherits the same drill-down, sorting, and data lineage capabilities as the built-in views.
Edit mode gives you full control with drag-and-drop card reordering, inline editing, and version history with rollback.
Views and filters
One dashboard, many perspectives. Switch between Sales Manager, Operations, Finance, and Executive views with a single click. Each view shows purpose-built KPIs, charts, and metrics for that function. Access is controlled by MS365 roles, so users only see the views they’re authorized for.
Filter any view by fiscal year or quarter. The system maps your time selection to the correct date fields across every SAP report automatically. Switch from FY 2026 to Q1 2026 and every KPI, chart, and drill-down updates in seconds.
Data access flows through to the ERP. The dashboard doesn’t store copies of your data. Every number is fetched live using the viewing user’s own SAP credentials and permissions.
Ask about pipeline, revenue, forecasts, open orders, invoices, or any data your ERP holds
Get instant breakdowns by rep, stage, region, account, or time period
Receive visual charts and tables alongside plain-English insights
Drill into any metric to see the individual records behind it
Switch between Sales, Operations, Finance, and Executive views
Filter by fiscal year or quarter with one click
Reference dashboard cards by name and ask the AI to explain or modify them
Add new dashboard cards through conversation, backed by live ERP queries
Export any view to Excel with formatted data, formulas, and charts
Trace every displayed number back to its exact ERP API query
Built for mid-market teams running SAP ByDesign and NetSuite. An authentication architecture that propagates each user’s identity directly to the ERP across three federated security boundaries. No service accounts. No shared credentials. No data copies. Setup typically takes days, depending on your ERP and permissions.
FlashpointBI is patent-pending technology developed by YTBE, Inc.
What your team can do today
Everything below works against your live ERP.
- Ask about pipeline, revenue, forecasts, open orders, invoices, or any data your ERP holds
- Get instant breakdowns by rep, stage, region, account, or time period
- Receive visual charts and tables alongside plain-English insights
- Drill into any metric to see the individual records behind it
- Switch between Sales, Operations, Finance, and Executive views
- Filter by fiscal year or quarter with one click
- Reference dashboard cards by name and ask the AI to explain or modify them
- Add new dashboard cards through conversation, backed by live ERP queries
- Export any view to Excel with formatted data, formulas, and charts
- Trace every displayed number back to its exact ERP API query
FlashpointBI questions
The things people ask before the first call.
Does FlashpointBI keep a copy of our data?
The dashboard doesn’t store copies of your data. Every number is fetched live using the viewing user’s own SAP credentials and permissions.
Who can see what?
Every query runs under the asking user’s own credentials. Your ERP’s permission model is enforced automatically, so sales reps see their accounts, managers see their teams, and finance sees the full picture.
Which ERPs does it work with?
Built for mid-market teams running SAP ByDesign and NetSuite.
Where does each number come from?
For full transparency, every card and drill-down includes a data lineage view showing the exact ERP report, fields, filters, and API query that produced the displayed values.
Can we change what the dashboard shows?
The AI can add new cards to your dashboard, backed by live ERP queries. Publish changes for your team or keep them as a personal draft.
How long does it take to deploy?
Setup typically takes days, depending on your ERP and permissions.
Ready to talk about your ERP?
Talk to us about using FlashpointBI with NetSuite or SAP ByDesign.